
Crypto Analysts Wanted: Prizes in USDC
We've just integrated Coingecko data into Glint Analytics, and we're ready to see what you can build with it. This is your chance to showcase your dashboard creation skills while earning real rewards.


The Challenge
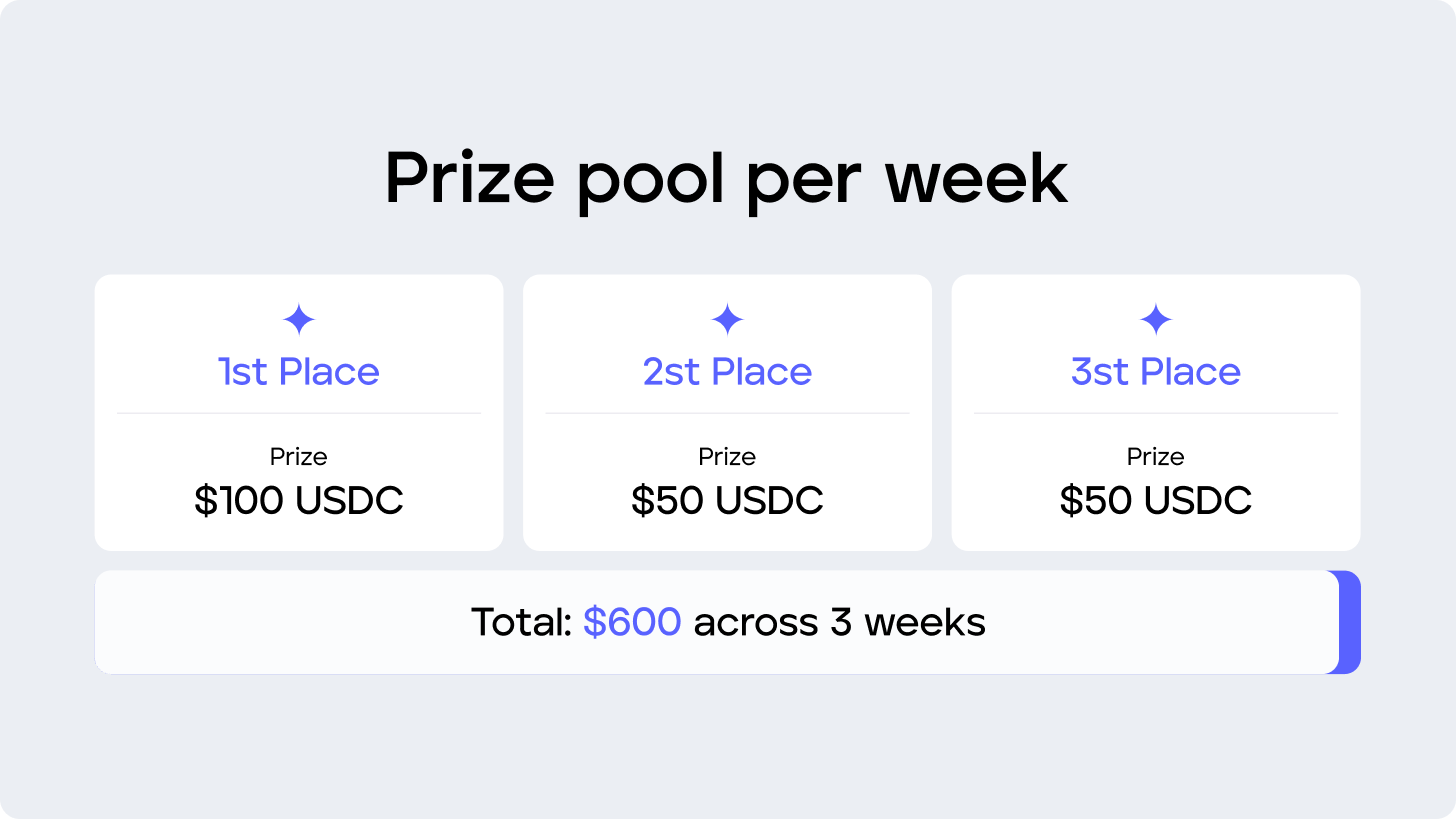
Duration: 3 weeks
Prize Pool: $600 in USDC
Data Source: Fresh Coingecko integration on Glint
Winners: Top 3 submissions as voted by the community
How It Works
Pick a theme - Choose from our dashboard ideas below (or freestyle it)
Build on Glint - Leverage our new Coingecko data integration
Ship it - Submit on SuperTeam Earn
Community votes - Let the builders decide the winners
Get Rewarded - Top 3 performers earn USDC every week
Dashboard Ideas Menu
We’ve created this list of ideas. They are meant to be inspiration, not rigid requirements. Adapt based on available data, enhance with additional metrics you discover, or streamline where needed. Your goal is crafting dashboards that balance functionality with visual appeal.
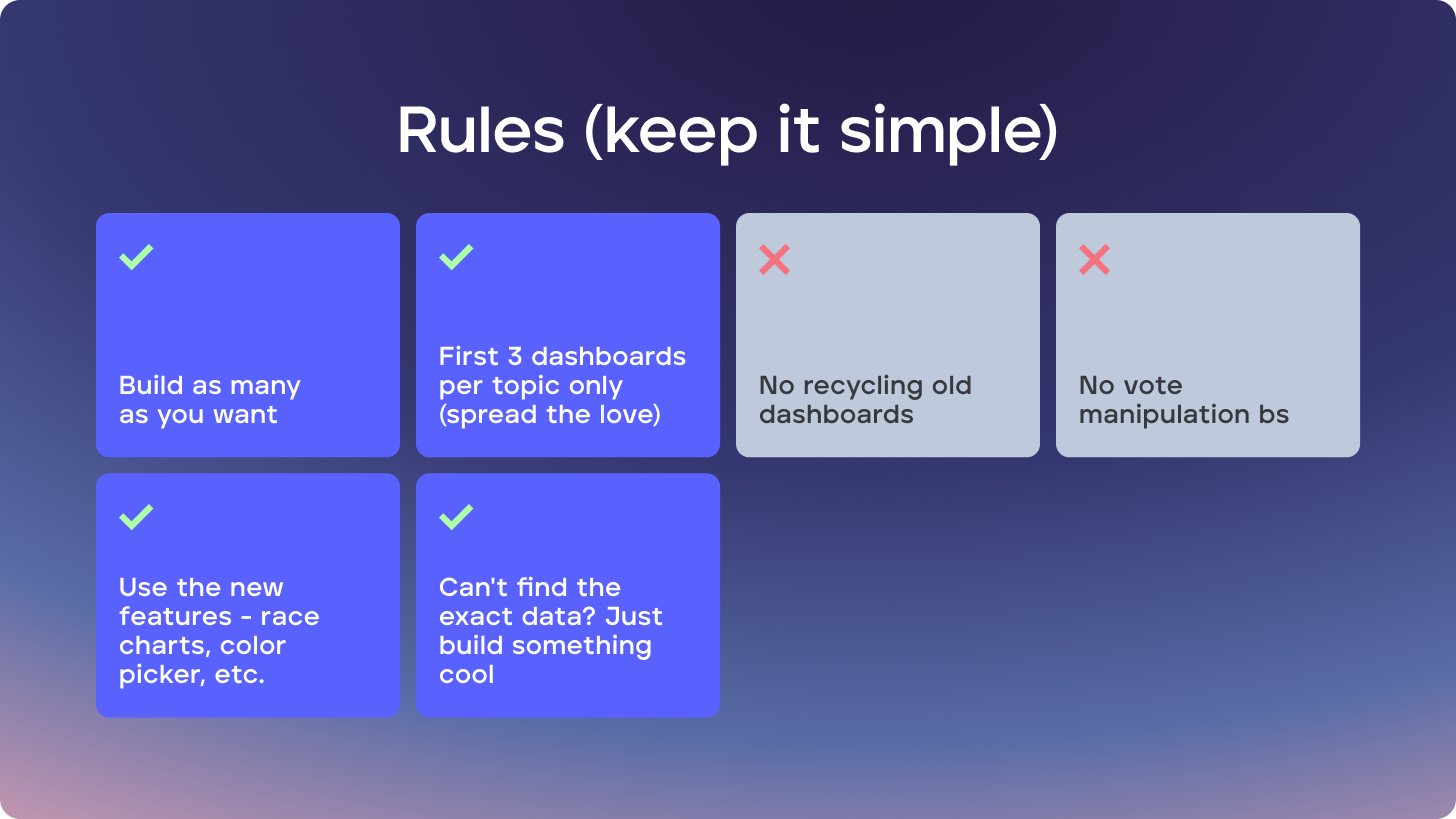
We're accepting the first 3 submissions per topic:

1. Polymath Compliance-Chain Dashboard 🏛️
Focus: POLYX & RWA Analytics
Key Metrics: Market performance (price, mcap, volume), RWA relative index, exchange listings, 30-day volatility
Visuals: Time-series charts, volatility heatmap, Sankey flows
2. Pump.fun Launchpad Pulse 🚀
Focus: Solana Memecoin Factory
Key Metrics: Daily listings, time to $1M mcap, ROI cohorts (24h/7d/30d), survivor rates, top 20 volumes
Visuals: Race bar chart, survival curves, ROI box-plots
3. Perpetuals DEX Leaderboard ⚔️
Focus: On-chain Perps Dominance
Key Metrics: Daily volume & OI, exchange breakdown (Hyperliquid, dYdX, GMX), market share, funding rates
Visuals: Stacked area, funding heatmap, radar plots
4. Pump.fun Ecosystem Index 📈
Focus: Meme Index vs SOL
Key Metrics: Market-cap weighted index, performance vs benchmarks, liquidity metrics, correlation matrix
Visuals: Dual-axis charts, treemap weights, rolling Sharpe
5. "Made in USA" Category Monitor 🇺🇸
Focus: U.S. Token Regulation Impact
Key Metrics: Category mcap, SEC/Fed news reactions, CEX/DEX splits, BTC beta & volatility
Visuals: Event-study lines, volatility heatmap, volume splits
6. RWA Momentum Dashboard 🏗️
Focus: Real-World Assets Growth
Key Metrics: Category mcap/volume, treasury vs commodity splits, yield correlations, new listings
Visuals: Sankey flows, box-plot returns, dual-axis charts
7. Oracle Token Stress-Test 🔮
Focus: LINK, BAND, DIA, API3 Resilience
Key Metrics: Drawdown performance, liquidity drops, supply vs price, staking yields, correlations
Visuals: Event-window candles, recovery waterfalls
8. Binance Launchpad Alumni Tracker 🎓
Focus: IEO Life-Cycle Performance
Key Metrics: ROI milestones (1d to YTD), ATH multiples, liquidity evolution, unlock schedules
Visuals: ROI box-plots, unlock Gantt overlays
9. Prediction-Market Token Adoption 🎯
Focus: Event-Driven Token Performance
Key Metrics: Price vs events, election/sports correlations, active markets, fee revenue, volatility
Visuals: Calendar heatmap, bubble charts, event overlays
10. Inscriptions Protocol Fever Index 🔥
Focus: ORDI, SATS & Fee Impact
Key Metrics: Top 20 performance, fees burnt vs price, chain distribution, CEX/DEX volume
Visuals: Area charts, chain distribution bars, volume heatmap
11. DeFi Blue-Chip Resilience 💎
Focus: AAVE, UNI, MKR, COMP Health
Key Metrics: Price/mcap/volume, TVL ratios, ETH beta, liquidity depth, max drawdowns
Visuals: Time-series, beta heatmap, drawdown waterfalls
12. Liquid-Staking Boom Monitor 🌊
Focus: LST Expansion & Yields
Key Metrics: LST mcap & dominance, yield spreads (stETH, rETH), peg deviations, Curve depth
Visuals: Dominance charts, peg deviation lines, APY spreads
13. Top-10 Stablecoins Health Board 💵
Focus: Stablecoin Peg & Velocity
Key Metrics: Peg deviations, supply trends, velocity ratios, $1M swap slippage
Visuals: Peg heatmap, supply areas, velocity scatter plots
14. Ethereum Rollups Race Panel 🏁
Focus: OP vs ARB vs MNT Competition
Key Metrics: Token metrics, bridging inflows, revenue/mcap ratios, ETH beta & correlations
Visuals: Price index, revenue scatter, correlation matrix
15. Modular Blockchains Scorecard 🧩
Focus: Celestia & Avail Adoption
Key Metrics: TIA & AVAIL trends, listing growth, ecosystem mcap, volatility & depth
Visuals: Listing timeline, ecosystem treemap, depth bars
💡 Pro tip: Can't find exact data? Improvise! These are ideas, not strict requirements.
What Makes a Winning Dashboard
Clean, purposeful design over cluttered complexity
Actionable insights that tell a compelling data story
Creative use of visualizations - race charts, heatmaps, and interactive elements
Thoughtful adaptation of available data into meaningful narratives
Rewards & Recognition
Beyond the USDC prizes, winners receive:
Featured placement in the Glint ecosystem
Community recognition and builder credibility
Portfolio pieces showcasing your analytical skills
Ready to Build?
Can't find the exact data mentioned in a brief? Work with what's available and create something impactful. The best dashboards often emerge from creative problem-solving and resourceful use of available data.
This is more than a contest—it's your opportunity to help shape the future of on-chain data intelligence while getting rewarded for your creativity and skills.
Let's illuminate the data together.
Submit your dashboards on SuperTeam Earn. Community voting determines winners. Not financial advice, just dashboard advice.
GM
Glint turns data into clarity with AI precision